@de_employees can you check?
1 Like
Currently, I am running my production home automation docker stack, which also contains a deCONZ container on a Raspberry PI 4 aarch64.
As I described in this thread I am experiencing problems with versions > 2.23.2.
Today I installed a fresh Raspberry Pi 3B armv7l, copied the mapped /opt/deCONZ directory, and plugged over the same conbee II from the production server.
I wanted to isolate the problem as much as possible and try to run 2.23.2 and 2.24.3 for comparison.
The result is the same as on the production stack.
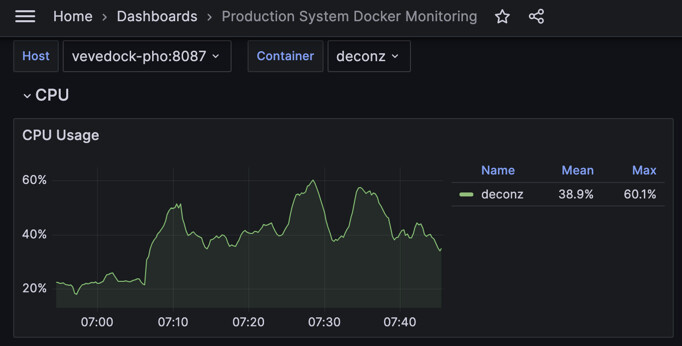
One interesting thing is the CPU load, for 2.24.3 it is much higher, at 18:38 I switched from 2.24.3 to 2.23.2:

I am also having this issue after upgrading yesterday from 2.23.2 to 2.24.3. Slow response time for all devices, missed service calls, and higher-than-normal cpu usage for the docker container. The web ui is also very slow. Reverted to 2.23.2 and all is well again. I’m using a Conbee II with Docker on a Synology DS718+/
I have created an “all-in” log file with all log options checked:
and again the CPU goes up
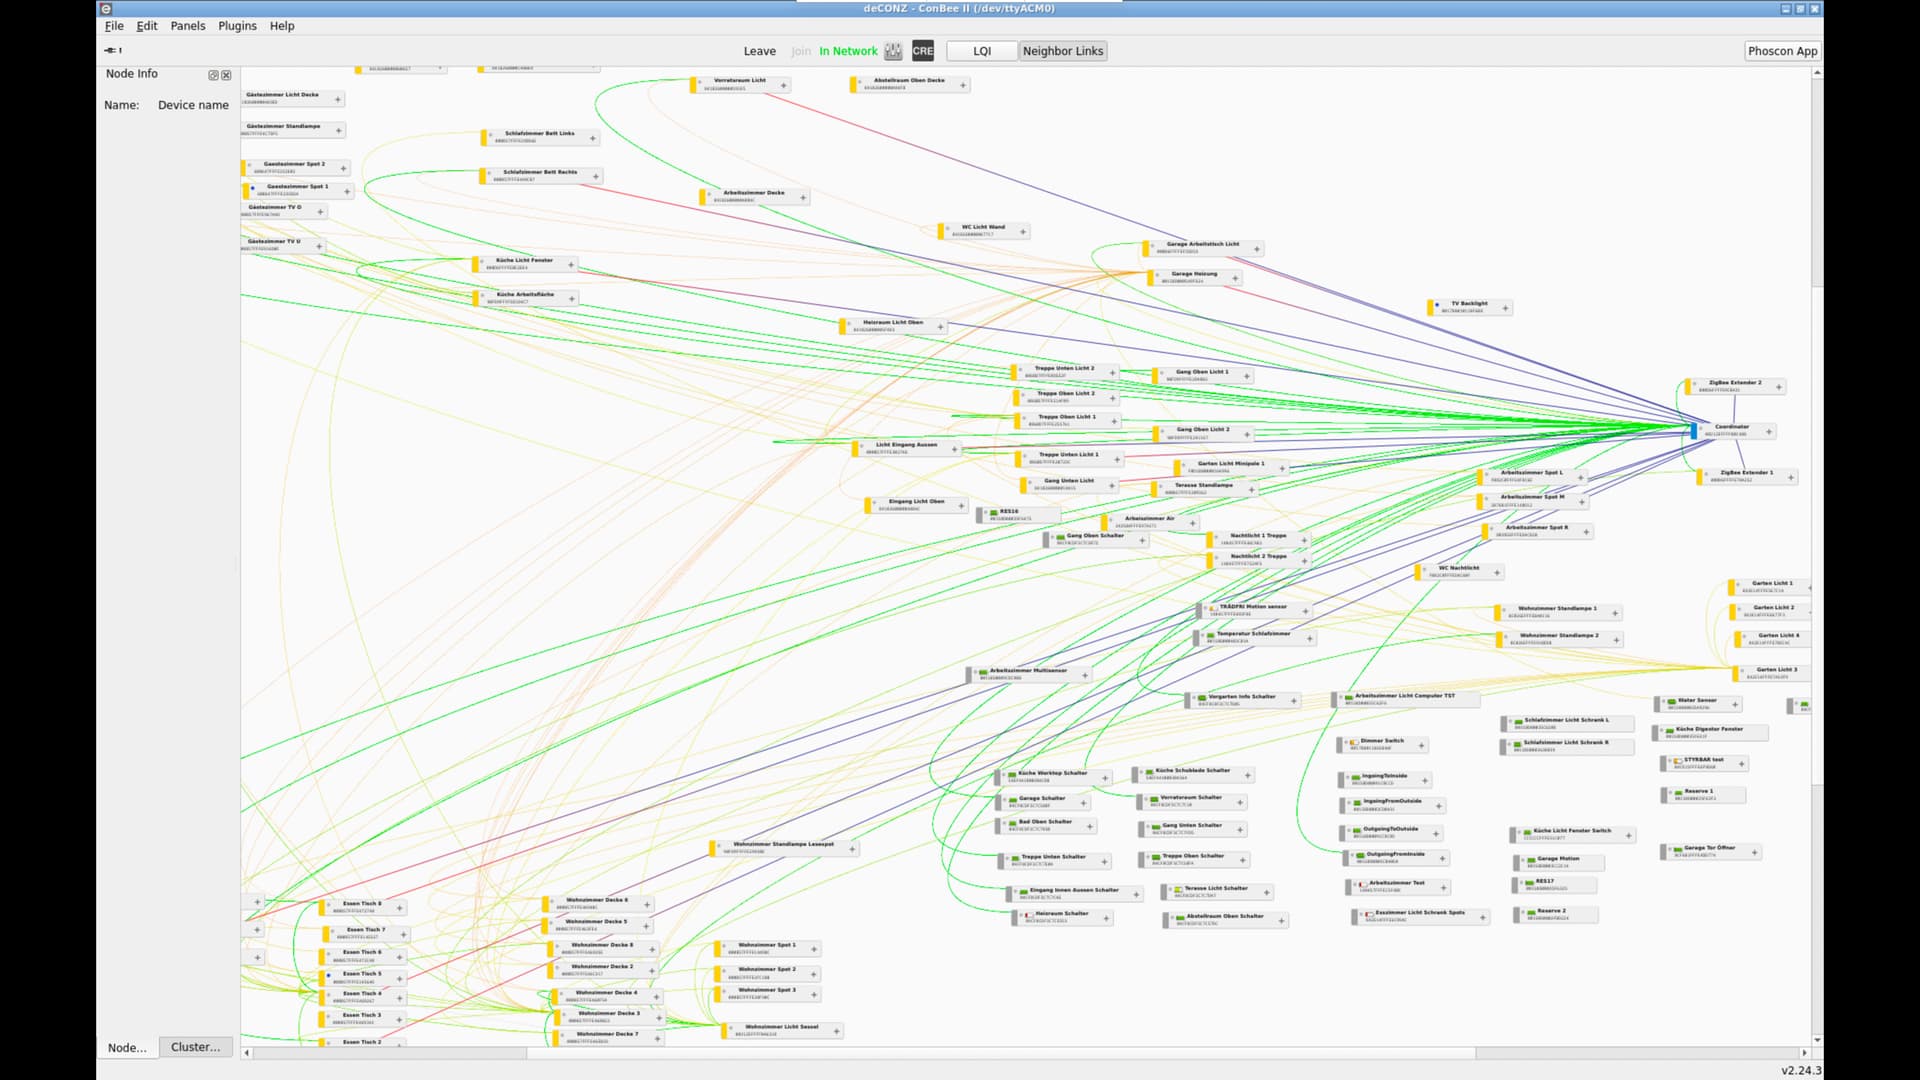
Can you share a screenshot of the deCONZ gui?
I have the suspicion something is off with the LQI’s and network buildup.
The higher CPU usage is indeed weird, I’m gonna make some tests with a profiler.
The logs themself look mostly fine, expect the 0x86 unsupported attribute status codes. As far as I can tell these are due older Philips Hue firmware which don’t support the attributes referenced in the DDF.
The slowness, is that perhaps with devices that are connected to the devices on the left top and bottom? The connections can be better IMHO, and that might cause the slowness.
Still, the topography does not change when just stepping up the version.
Is the Conbee III something better than the Conbee II in regards to LQI and other stuff?
@lukicsl can you please also enable DEV and DDF logging with v2.24.3.
From the logs I see a few things which take longer than used to be, mainly for legacy code devices here I’d like to see if more logging context gives some insights what’s happening.
Have you looked at these?
Ha right indeed the DEV and DDF is in there. I’ve checked various code paths yesterday to figure out what can cause the high CPU usage in you network. In my test setup there is only the normal CPU usage of average 2-5% after initial load.
A significant difference is that your network has a higher mix of legacy vs. DDF driven devices than mine, and the high CPU load depends on what devices are in the network, that’s why it can be seen in some but not all setups.
Over the past year there were many additions of new DDFs for various devices (currently ca. 330 DDFs with >600 modelid/manufacturer name pairs), and I think this causes the legacy code paths to be more stressed. It’s a bit difficult to describe, but the legacy code has a few interception points with new DDF code which in worst case can lead to large checks against all DDFs eating CPU cycles. My guess here is that this amplifies at some point, like the logs show over 3000 string comparisons after receiving a command in one case which is nuts.
Long story short I’m in the process to refactor a few things to prevent useless tasks in the legacy code and also prevent repeated requests which will always fail like the 0x86 attribute unsupported error shown in the logs.
Hope to have this ready for testing in a couple of days. Note that this is only an assumption currently we’ll only see after testing if this is indeed the root of the issue.
1 Like
Hi Manup,
I don’t want to be impatient ![]() , but have you been able to test some things already? It seems once again that this issue may cause a new delay in the HA deCONZ addon (which is already taking many months).
, but have you been able to test some things already? It seems once again that this issue may cause a new delay in the HA deCONZ addon (which is already taking many months).
Thank you for your great work!
Hi, yes after digging deeper in the legacy code and also checking the profiler I think we found some spots which have larger impact on keeping the CPU busy. It’s one of this rabbit holes where heaps of stuff shows up which needs to be optimized.
Here is a 3 minutes flame graph showing effects of some cleanups, prior here was a lot of GUI redrawing shown and some needless looping over devices and internal data.
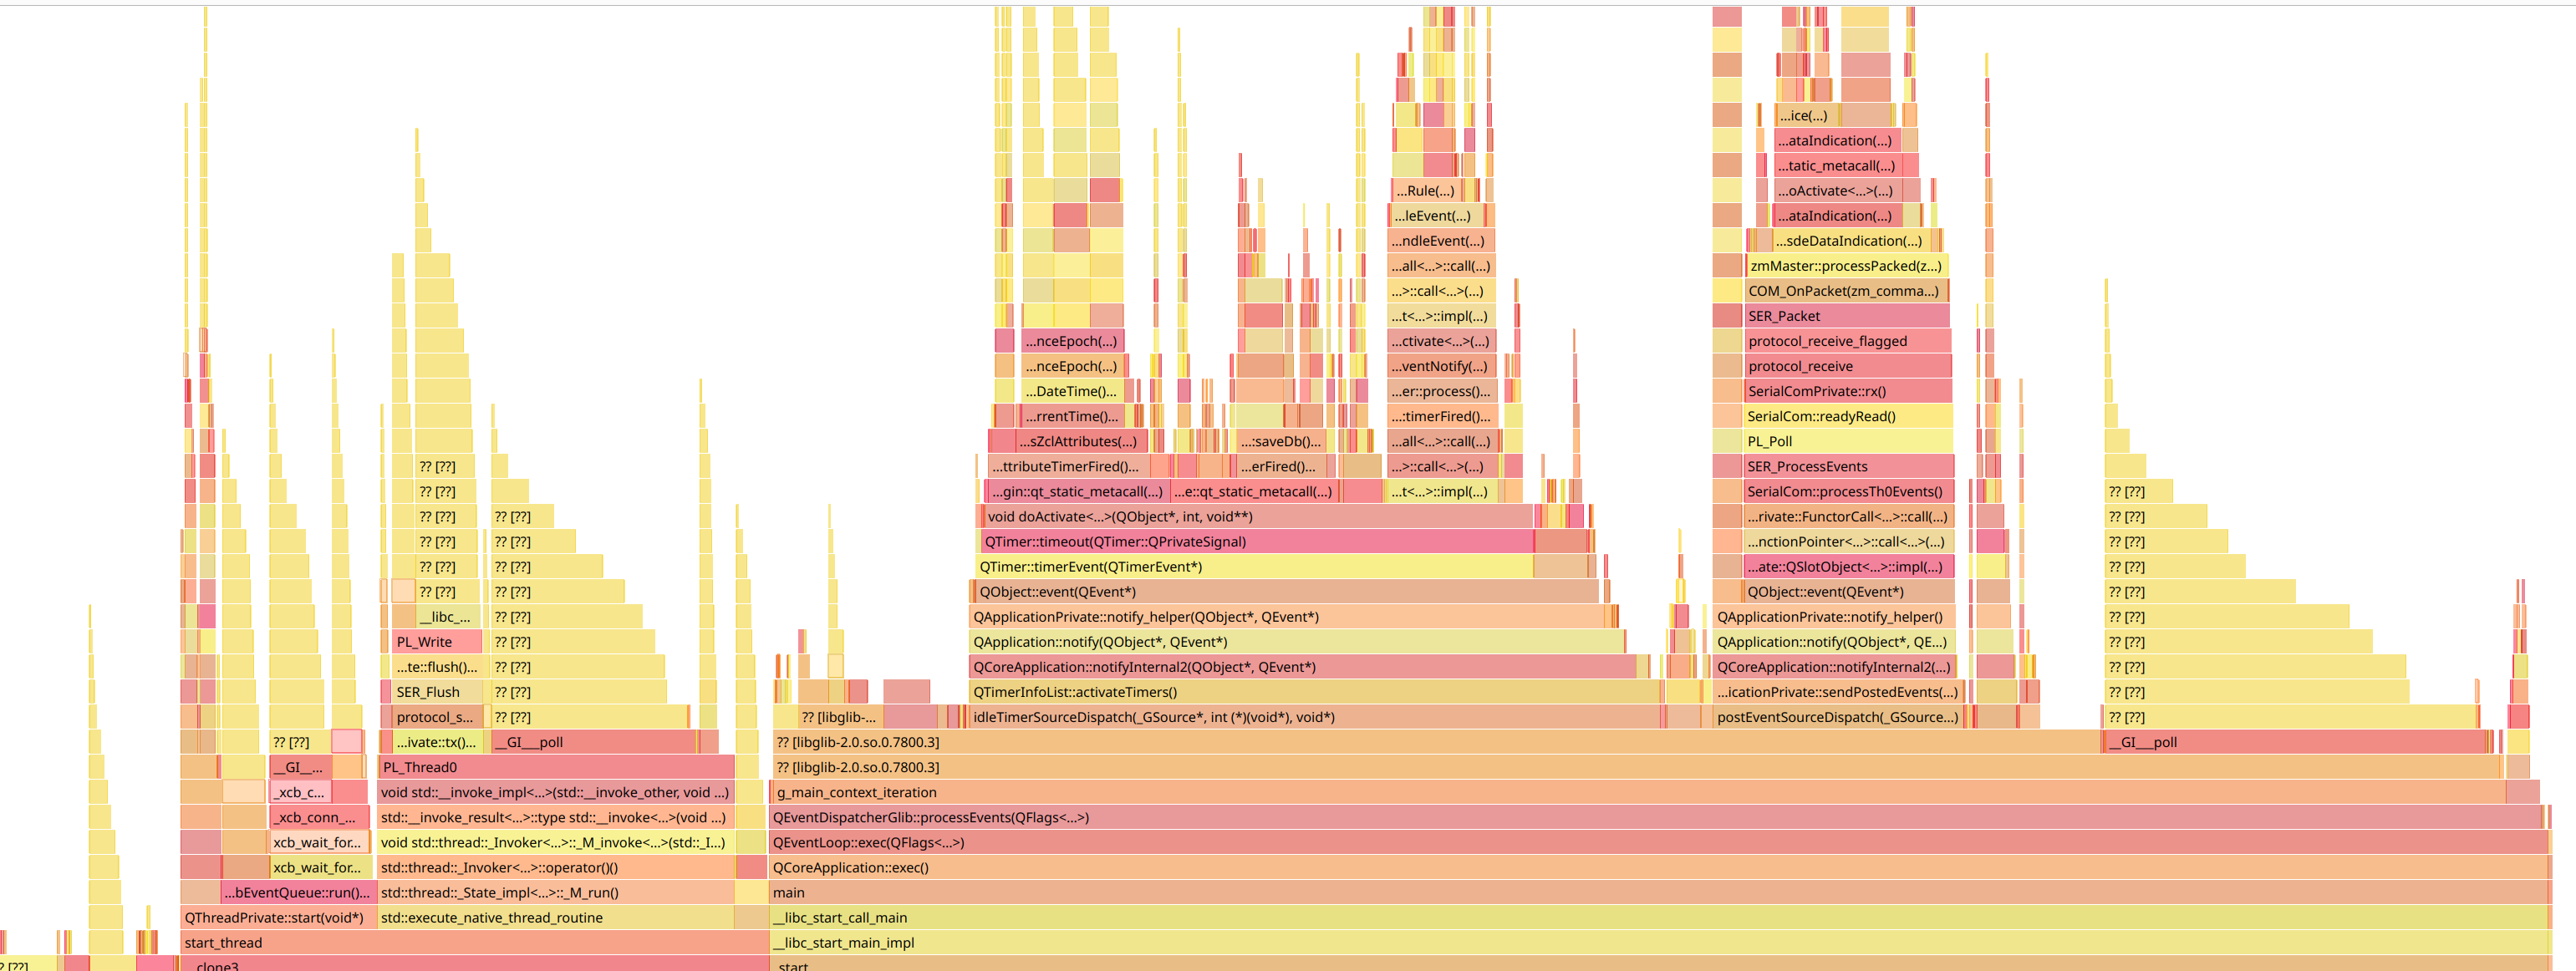
The graph shows also more potential to get rid of cycle eaters in future releases (here mainly the middle and left sides do way too much work than needed).
I’m creating a test release for arm version later today to see if the changes improve another developer setup where similar issues can be seen.
1 Like
If it’s not too much work, a docker image wold be great!
Thats something the docker guys need to do. @phdelodder could this be done?
Create an issue and I’ll look into it
That probably can be done after its there.
I’ll ping you on discord.
Thank you to all the devs for all of the great work you do to keep deconz running smoothly.
1 Like